Mapping Running Culture
How and why do people engage with running? It’s a question that can’t easily be answered by looking at one or two factors. So in an attempt to capture the full complexity, I used a technique called Multiple Correspondence Analysis (MCA) — a powerful statistical tool for detecting patterns and mapping relationships across a large number of variables.
MCA, pioneered in sociology by Pierre Bourdieu, helps uncover the hidden structures in messy, complex datasets. Think of it like creating a map, where individuals and their answers are represented as points. If two points are close together, it means those runners share similar motivations or habits. By studying the patterns on these maps, we can uncover the main principles that organise the “field” of running — the broad space of practices, motivations and social differences between runners.
I’ll explain the main findings below, with reference to the charts that will follow. (For those who want a deeper technical dive, the method is explained fully by Le Roux and Rouanet, 2010.)
How the Maps Were Created
The process began by selecting 60 key motivations and practices from survey responses. Each variable (like whether someone runs obstacle races, or their motivation to “run fast times”) was included in the analysis both in a positive form (“does OCR”) or its opposite (“does not do OCR”). To avoid clutter, only the most important variables are displayed on the charts.
Hopefully most of the variable names will be intuitively clear, but here is the full key:

In addition to running practices and motivations, the maps include supplemental variables — social factors like gender, age, education, occupation, and self-perceived running talent. These do not influence the structure of the charts, but show how social characteristics relate to styles of running.
Importantly, the maps are multidimensional, with each dimension relating to a different axis along which running practice varies. The dimensions are ranked in order of importance. So dimension 1 accounts for more differences than dimension 2 etc.
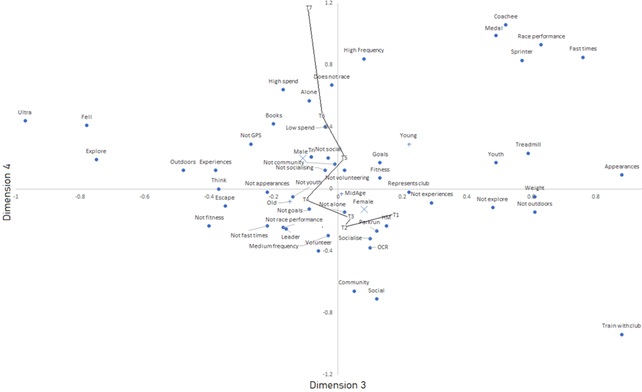
Figure 1 shows the first two main dimensions of variation; Figures 2 and 3 show the third and fourth, with different supplemental variables included (supplemental variable keys in chart titles).
I’m sorry the chart labels are so small! If you’d like larger versions please email me.

Supplemental categories: Gender (large diagonal crosses). Age (small vertical crosses. Young: Under 30; MidAge: 30-49 years; Old: 50+ years). Perceived talent (T1-T7 with linking line).
Supplemental categories: Gender (large diagonal crosses). Age (small vertical crosses. Young: Under 30; MidAge: 30-49 years; Old: 50+ years). Perceived talent (T1-T7 with linking line).

Supplemental categories: Cultural capital (highest level of education) rank (C1-C4 with linking line). Subdivisions of NS-SEC 1 occupational categories (boxed and capitals).
Interpreting the Maps: Four Key Dimensions
The MCA revealed four main dimensions that structure the field of running:
1. Degree of Engagement (10.2% of variance)
The first and most important dimension (shown on the horizontal axis of Figure 1) captures how deeply engaged someone is with running.
- At one end of the axis are casual runners: those who run infrequently, don’t take part in events, and spend little money on running.
- At the other end are highly committed runners: frequent participants, heavy spenders, and people deeply involved socially and competitively in running.
Interestingly, factors like age and gender have little effect here. What matters most is perceived talent: runners who see themselves as talented are much more engaged.
So, runners with more “running capital” (skill, ability, status) tend to invest more heavily in the sport.
2. Self-care versus Competition (6.4% of variance)
The second dimension (the vertical axis of Figure 1) separates those who run primarily for self-care from those motivated by competition.
- At the self-care end: motivations include managing weight, looking young, escaping daily stresses, and improving appearance. Treadmill users dominate here.
- At the competition end: motivations centre around winning medals, running fast times, and representing clubs.
Gender plays a major role here. Women are more likely to run for self-care reasons, while men are more often motivated by competition. Talent also matters, but gender is the stronger influence.
Competition and self-care are two powerful but to some extent opposed reasons people run — and gender is a major factor shaping which is more important.
3. Goals versus Experiences (5.7% of variance)
Dimension three (horizontal axis in Figures 2 and 3) is a little subtler. It distinguishes between runners focused on specific goals (like racing fast or losing weight) and those motivated by the experience of running, especially being outdoors.
- Goal-focused runners include track sprinters and those using treadmills and dieting.
- Experience-focused runners are more likely to be fell-runners or ultra-marathoners, drawn to adventure and nature.
Here, education and occupation become important. Higher levels of education are linked to a preference for the experiential, outdoorsy side of running. People in high-status but less culturally privileged roles (like senior managers) are more goal-oriented, whereas academics and researchers lean towards experience for its own sake.
So social class differences — particularly levels of education — appear to influence whether runners report pursuing goals or seeking experiences.
4. Individual versus Social Orientation (4.3% of variance)
Finally, dimension four (vertical axis in Figures 2 and 3) distinguishes runners who focus on social interaction from those who prefer individual achievement.
- At the social end: runners motivated by community, socialising, volunteering, and participating in group events like parkrun.
- At the individual end: competitive solo runners, often training alone with personal goals in mind.
Again, gender and age shape this division: women and older runners tend to be more socially oriented; men and younger runners lean towards individualism. Talent also correlates with individual focus.
Whether running is a social or solitary pursuit appears to depend on gender, age, and self-perceived ability.
A Quick Summary
Although these four dimensions explain only about 27% of the total variation across all runners (suggesting a lot of individual diversity), they give us a powerful framework for understanding the field:
- How engaged someone is with running overall
- Whether they are more motivated by self-care or competition
- Whether they focus on specific goals or experiential enjoyment
- Whether they pursue running socially or individually
The maps show that perceived talent is the most consistent driver across all dimensions — it acts as a kind of “physical capital” that influences both engagement levels and style. Gender plays a crucial role, especially in motivational orientation and social versus individual preferences. Age also matters, especially for the latter dimensions. Class (via education and occupation) shows up more selectively, particularly around the goals/experiences split.
The table below lists some recognisable types of runners based on their map positions.
| Form | Dimension 1 | Dimension 2 | Dimension 3 | Dimension 4 |
| Track sprinting (athletics) | High engagement | Competitive | Goal focused | Individual orientation |
| Half marathon (road running) | Somewhat engaged | Not distinctive | Not distinctive | Not distinctive |
| Fell- and Ultra- running | High engagement | Competitive | Experience focused | Individual orientation |
| Obstacle course racing | Not distinctive | Not distinctive | Not distinctive | Social orientation |
| Non-racing | Low engagement | Somewhat self-care | Not distinctive | Individual orientation |
| Treadmill running | Not distinctive | Not distinctive | Goal focused | Individual orientation |
Populating the Maps
Finally, I’ll leave you with a picture of the distribution of runners across the cultural space mapped. Figures 4 and 5 below show where every runner I surveyed (almost 2,700 of them) is situated on each of the four dimensions. The named runners are some of those I interviewed, allowing me to corroborate the relationship between their orientation to running as they described it and their position on the maps (see my book for details).


Yes, a complicated, statistic-heavy, eye-straining post!
But I hope the maps make some intuitive sense and help give a picture of the diversity and hidden structure within running practice. Just contact me if you have any questions or would like to see higher resolution versions of the charts.
Reference: Le Roux and Rouanet, 2010: Sage Research Methods – Multiple Correspondence Analysis

Hello! I'm Dr. Neil Baxter, a social scientist, runner, and author of this blog.
You can reach me via neil@runningstudies.co.uk.
Leave a Reply
You must be logged in to post a comment.