From a sociological point of view, one of the interesting things about running is its association with high levels of privilege – particularly with education and income. This seems surprising: Unlike sports such as tennis, cycling or golf, running requires no expensive equipment or club membership; all most people really need to participate, it has been said, is a pair of trainers and a front door.
In this and my next post I want to explore the social status of runners in detail, drawing on data from Sport England’s Active Lives Survey as well as my own Big Running Survey, conducted a few years back. The next post will focus on social stratification within running – highlighting how different types of running are associated with different social groups. This post though, places running in the wider context of sporting leisure more generally: How does running compare socially to other sports?
Once we have a good picture of the social characteristics of running in place, later posts will explore how these relationships are forged and maintained, and what implications they have for the meaning of the sport and the identities it supports.
Running in context
Using data from Sport England’s Active Lives Survey 2018*, a huge study of the active leisure habits of close to 200,000 people, it’s possible to compare a wide range of sports in terms of their participants’ levels of education and the type of jobs they do.
Let’s start by comparing some popular sports in terms of education, or more specifically, the percentages of their participants that are degree holders. The red line indicates the percentage of degree holders across the whole sample, which includes people who participate in any sport as well as in none.
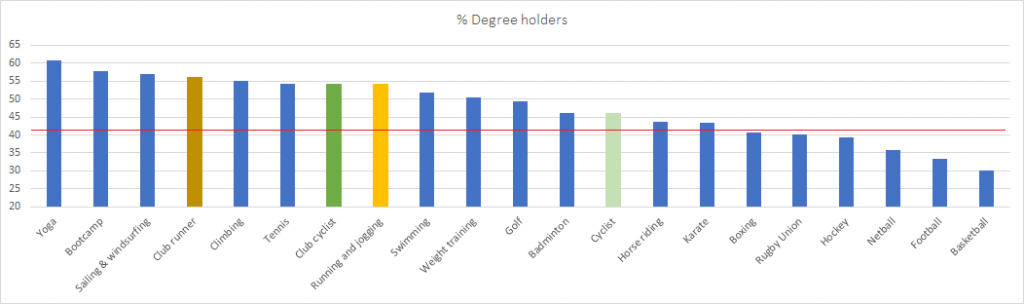
I’ve coloured the bars for running gold. As you can see, I’ve included two groups of runners. The light gold bar represents all runners, and the dark gold picks out just those who are club members. For comparison, I’ve done the same with cycling, in light and dark green.
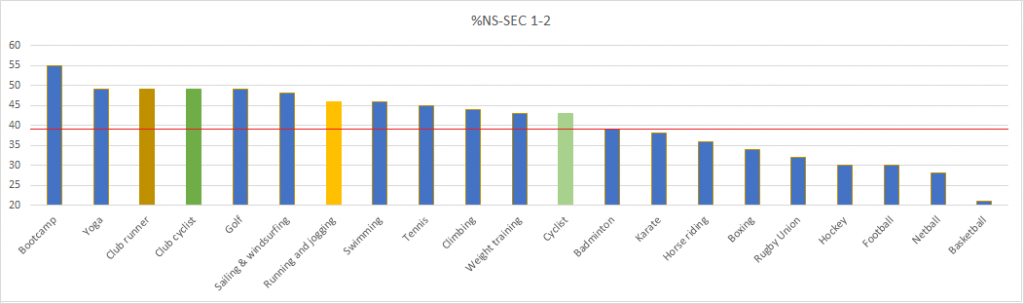
Now let’s look at the occupations of participants in the same set of sports. Here, the metric is the percentage of participants who are hold managerial or professional roles. I’m using the Office for National Statistics’ categories NS-SEC 1-2, as defined below:
| 1 | Higher managerial, administrative and professional occupations |
| 1.1 Large employers and higher managerial and administrative occupations | |
| 1.2 Higher professional occupations | |
| 2 | Lower managerial, administrative and professional occupations |
These occupational categories encompass often well paid, office based ‘white collar’ work. In other words, they broadly reflect middle-class jobs. Here is the chart, colour coded as before.
Both charts indicate that the education and occupational class of participants in the majority of sports considered here are above average. This reflects the well-established fact that there is a strong relationship between social class and and engagement in active leisure in this and many other countries.
Across education and occupation, there is a fairly consistent pattern (as we would expect given the relationship between these two variables): Team and combat sports present the lowest percentages on the two measures, and body-shaping / fitness maintenance (what I will call self-care) related activities score highest.
Running, which for some is certainly primarily an exercise in self-care, is associated with levels of education and occupational class well above average, and sits close to such traditionally middle-class sports as yoga, golf, sailing, tennis.
Interestingly though, club running, which might be assumed to attract more competitively oriented (and less self-care focused) runners than the more general ‘running and jogging’ category, scores significantly higher than the latter on both measures. This pattern is also apparent in the equivalent groups of cyclists.
The social differences between club and general runners described here hint at wider disparities within the sport, which will be the subject of my next post.
* Sport England, 2018. ‘Active Lives Survey, 2016-2017’. [data collection]. UK Data Service. SN: 8391, http://doi.org/10.5255/UKDA-SN-8391-1.